How to translate interactive graphics from Mathematica to standard HTML+SVG?
Animations as interactive visualizations
The simplest form of interactive graphics is an animation in which the play head can be moved by the user. That doesn't sound very interactive, but in terms of functionality the play head is nothing but a type of Slider.
With this simple interpretation of interactivity, any movie format supported by Export would be a way to create a standalone "interactive" visualization.
The starting point for this approach would be to generate a list of graphics that will form the frames of the animation:
frames = Table[
   Plot[Sin[φ x]/(φ x), {x, -1, 1}, Background -> White, Frame -> True,
    PlotRange -> {{-1, 1}, {-.5, 1}}], {φ, Pi,10 Pi, Pi/2}];
I've added a Background to the plot because it will be needed to make the SVG version of the movie come out properly below.
Frame based animations with SVG
But the other part of your question is specifically asking about SVG and HTML format. In SVG, you can create animations by moving elements around using JavaScript. But that's not something you can easily automate in exporting a Mathematica dynamic object - it would require case-by-case fine tuning.
So instead, I pursued a totally different way to combine the first point (the movie paradigm) with SVG: export an animation in which each frame is a static SVG vector graphic. Then the interactive element is again realized by the mere presence of the play head as a slider.
To make this a little more interesting than a typical movie player, I also added the ability to export a sequence of N graphics but create a larger number M > N of frames from them in the animation. This is achieved by allowing an indexed list to specify the movie frames, so the M frames can walk through the N graphics in any order with arbitrary repetitions during playback.
The Javascript movie player
The whole thing is based on a JavaScript movie player I had written earlier, so you also get the ability to encode your frames as standard PNG bitmaps instead of SVG.
The special thing about the player is that it's a single standalone HTML file. All movie frames are embedded in the HTML using base64 encoding, so the animation remains just as portable as a normal movie, GIF etc.
But the SVG playback ability is what makes this most relevant to your question. Since SVG takes more resources to store and interpret during the display, one can notice that the player is somewhat slower to start up when you choose SVG format instead of the default PNG format.
However, the nice thing is that SVG animations can be enlarged without loss of quality, even while the movie is running.
I'm putting this out there for experimentation, and SVG may not turn out to be the best choice for your application. But then you can still go with PNG and get a smooth frame animation with full slider control.
The JavaScript player has some additional features in addition to a draggable play head. Since it's frame-based, you can interactively change the frame delay, press a to display all frames side-by-side, and change the looping behavior.
htmlTemplate =
    Import["http://pages.uoregon.edu/noeckel/jensPlayer/jensPlayerTemplate.js", "Text"];
jensPlayer[name_?StringQ, a_?ListQ, opts : OptionsPattern[]] := Module[
  {delay = 50, dataType = "img", htmlString, htmlBody,
   scaledFrames, n, i, movieFrames, dimensions, frameStartTag,
   frameEndTag, exportFormat, imgSizeRule,
   loopOptions = {"Loop" -> "rightLoopButton",
     "None" -> "noLoopButton", "Palindrome" -> "palindromeButton"},
   toolHeight = 25},
  n = Range[Length[a]];
  imgSizeRule = FilterRules[{opts}, ImageSize];
  If[imgSizeRule == {}, imgSizeRule = (ImageSize -> Automatic)];
  scaledFrames = Map[Show[#, imgSizeRule] &, a];
  dimensions = ImageDimensions[Rasterize[scaledFrames[[1]]]];
  With[{del = ("Delay" /. {opts})}, If[NumericQ[del], delay = del]];
  With[{ind = ("Indices" /. {opts})},
   If[ListQ[ind], i = ind - 1, i = n - 1]];
  Which[("SVG" /. {opts}) === True,
   dataType = "object", ("SVGZ" /. {opts}) === True,
   dataType = "embed"];
  If[dataType == "embed",
   frameStartTag = "<embed src=\"";
   frameEndTag =
    "\" width=\"" <> ToString[dimensions[[1]]] <> "\"height=\"" <>
     ToString[dimensions[[2]]] <> "\">";
   htmlString = "";
   movieFrames =
    Table[
     With[{svgName =
        name <> ToString[
          PaddedForm[i, Total@DigitCount[Length[scaledFrames]],
           NumberPadding -> {"0", " "}]] <> ".svgz"},
      Export[svgName, scaledFrames[[i]], "SVGZ"];
      frameStartTag <> svgName <> frameEndTag], {i,
      Length[scaledFrames]}];
   htmlString = StringJoin[movieFrames],
   If[dataType == "img",
    frameStartTag = "<img src=\"data:image/png;base64,";
    frameEndTag = "\">";
    movieFrames = Apply[If[("Parallel" /. {opts}) === False,
       Map, ParallelMap], {ExportString[#, "PNG"] &, scaledFrames}],
    frameStartTag = "<object data=\"data:image/svg+xml;base64,";
    frameEndTag = "\" type=\"image/svg+xml\"></object>";
    movieFrames = Apply[If[("Parallel" /. {opts}) === False,
       Map, ParallelMap], {ExportString[#, "SVG"] &, scaledFrames}]
    ];
   htmlString =
    StringJoin@
     If[("Parallel" /. {opts}) === False,
      Map[(StringJoin[frameStartTag,
          StringReplace[ExportString[#, "Base64"], "\n" -> ""],
          frameEndTag]) &, movieFrames],
      DistributeDefinitions[frameStartTag];
      DistributeDefinitions[frameEndTag];
      ParallelMap[(StringJoin[frameStartTag,
          StringReplace[ExportString[#, "Base64"], "\n" -> ""],
          frameEndTag]) &, movieFrames]
      ]
   ];
  htmlBody =
   StringReplace[
     htmlTemplate, {"**DATE**" -> DateString[],
      "**DATATYPE**" -> dataType,
      "**WIDTH**" -> ToString[dimensions[[1]]],
      "**HEIGHT**" -> ToString[dimensions[[2]]],
      "**TOOLHEIGHT**" -> ToString[toolHeight],
      "**DELAY**" -> ToString[delay],
      "**COMBINEDWIDTH**" ->  ToString[Length[a]*dimensions[[1]]],
      "**USERNAME**" -> $UserName,
      "**LOOPCONTROL**" ->
       With[{loopOption = ("Looping" /. {opts}) /. loopOptions},
        If[MemberQ[loopOptions[[All, 2]], loopOption], loopOption,
         "None" /. loopOptions]],
      "**INDICES**" -> StringJoin@Riffle[Map[ToString, i], ","],
      "**AUTOPLAY**" ->
       If[("AutoPlay" /. {opts}) === True, "true", "false"],
      "**TITLE**" -> name}] <> htmlString <> "</div></body></html>";
  Export[name, htmlBody, "TEXT"];
  ]
Examples
With this function you can now export the frames created earlier:
jensPlayer["sombrero.html", frames]

SystemOpen["sombrero.html"]

jensPlayer["sombreroIndexed.html", frames, "Delay" -> 60,
 "AutoPlay" -> True, "Looping" -> "Palindrome", "Parallel" -> True,
 "Indices" -> {19, 18, 17, 16, 15, 15, 17, 18, 19, 19, 18, 17, 16, 15,
    14, 13, 11, 9, 7, 5, 4, 3, 2, 2, 1, 1, 1, 1, 1, 2, 2, 3, 4, 5, 7,
   9, 11, 13, 15, 16, 17, 18, 19, 19, 19, 19}]

SystemOpen["sombreroIndexed.html"]

jensPlayer["sombreroSVG.html", frames, "SVG" -> True]

SystemOpen["sombreroSVG.html"]
Each of the export commands illustrates a different export format.
Options
By default, the images in list images are displayed sequentially with a constant time delay, in a single playback run. If the option "Indices" is specified, frames are played back in the order determined by that option, see below.
Options (except for ImageSize, all options are strings requiring quotation marks):
ImageSize- number of pixels in the horizontal direction. If unspecified, will be determined by size of the graphics in images.
"Looping""None"(default),"Loop""Palindrome"
"Delay"- number of milliseconds between frames (default
50)
- number of milliseconds between frames (default
"Indices"{i1, i2,... iN}, a list of (not necessarily different) integers between1andLength[images]. The number of frames in the movie isN.in(n = 1,...N) is the index in listaof the image to be displayed as framen.
"AutoPlay"TrueFalse(default)- sets whether the movie should start playing as soon as loaded.
"Parallel"True(default)False- switches between parallel/sequential image conversion.
Parallelspeeds up the export if more than one Mathematica Kernel is available.
"SVG"TrueFalse(default)- switches between
SVGorPNGformat for the frame export.SVGformat is provided on an experimental basis because browser support is evolving slowly. It is a resolution-independent graphics format that can be resized seamlessly in Firefox.SVGrequires larger startup time, so it should not be used for large movies. WithSVGyou should also specify an explicit background for the frames, e.g. by doingimages=Map[Show[#,Background->White]&,originalImages]. AlthoughSVGmovies yield much largerHTMLfiles,gzipcompression can make file sizes comparable to those ofPNGmovies (or even smaller). Since web servers increasingly are configured to transmitHTMLfiles using on-the-fly compression,SVGdoes not necessarily increase download times.
Additional notes
Because the JavaScript file is too unwieldy for this post, I put it on my web site and use Import in the jensPlayer function to load it. I would suggest that you download the file
http://pages.uoregon.edu/noeckel/jensPlayer/jensPlayerTemplate.js
and copy and paste it as a string into the htmlTemplate = assignment. Then you can use the function offline.
Also, I had tried SVGZ instead of SVG, and the function allows that as an option. However, this compressed SVG format doesn't play back so well apparently. Maybe the decompression is causing problems - I haven't had time to debug that yet. So I'd recommend you not use SVGZ at the moment, even though you may have seen it in the code above.
Illustrated example
To show what the movie should look like, here is a sequence of images that represent an electric field distribution for a range of separations d between two charged objects. The parameter d is then controlled with the movie slider:
field[a_, d_, x_, y_] =
  D[Log[((x - d)^2 + y^2)/((x - a)^2 + y^2)], {{x, y}}];
images = With[{r = 1.}, Table[
    Show[
     StreamPlot[field[1/d, d, x, y], {x, -2, 4}, {y, -3, 3},
      FrameLabel -> {"x", "y"}, StreamColorFunctionScaling -> False,
      StreamColorFunction -> "Rainbow",
      PlotLabel -> Row[{"d = ", PaddedForm[N@d, {4, 2}]}]],
     Graphics[{Thickness[.009], White, Circle[{0, 0}, r],
       PointSize[.03], Point[{d, 0}]}], Background -> GrayLevel[.2],
     LabelStyle -> White,
     FrameStyle -> Directive[Lighter@Gray, Thickness[.005]],
     ImageMargins -> 5],
    {d, 1.5 r, 4 r, r/4}]];

jensPlayer["imageChargesSVG.html", images, "SVG" -> True,
 "Parallel" -> False]
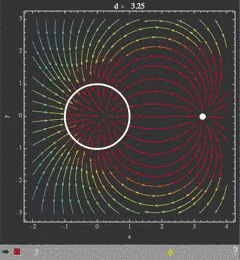
The movie is a screen recording of the JavaScript movie player in Google Chrome. The controls at the bottom fade in and out. The left-most control switches between single run, back-and-forth (palindromic) playback and looping. I show how to stop the movie by pressing the red button, and then drag the slider to get to a particular frame. After restarting and stopping agin, I click on the frame counter to get a dialog that allows interactive adjustment of the frame delay. After changing the delay to 250 milliseconds, the playback is slower.
There are several other keyboard shortcuts that are explained if you click the question mark at the bottom right. In particular, you can use arrow keys to move from frame to frame while the movie is stopped.
As Jens points out, we can certainly generate a single slider version of Manipulate in a web page. Evidently, someone else has recently taken up this challenge.
The correct, general answer is still no, there is no straightforward (built-in) way to convert Mathematica's dynamic objects to non-proprietary HTML+SVG/JS. To see why, consider how you might try to represent the following very simple example in HMTL/SVG:
Manipulate[With[{pts = {#, Sin[a*#]} & /@ (x /.
  Quiet[Solve[Sin[a*x] == b*AiryAi[-x] && 0 < x < 10, x],
    {Solve::nint, Solve::ratnz}])},
  Plot[{Sin[a*x], b*AiryAi[-x]}, {x, 0, 10}, Epilog ->
   {PointSize[Large], Point[pts]}, PlotRange -> {-1.1, 1.1}]],
  {{a, 1}, 1, 10}, {{b, 2}, 1, 3}]
Of course, the point is that most interesting dynamic illustrations in Mathematica will make use of Mathematica's extensive library of mathematical functionality - functionality not generally available in GeoGebra, D3, or javascript libraries such as processing.js or numeric.js. This exact point was made in the comments, but without example.
It is not my point to demean those other tools at all - simply to point out that their emphasis is different. If your objective to create broadly accessible (i.e., without plugins) illustrations based on simple mathematics, then perhaps you should focus on those types of tools. If you need to create illustrations that require more advanced (mathematical) functionality, then it will be hard to beat Mathematica. Clearly, Wolfram Research is aware of the need to disseminate material created with Mathematica and have released web Mathematica and CDF for exactly this purpose.
The particular example that I gave is very easy in Mathematica precisely because it has an excellent library of special functions and well integrated tools for solving equations involving those functions. (Any number of other examples could be given.) Implementing this example in javascript would be challenging, since you'd have to implement the fundamentals yourself.
It's amusing that some anonymous user chose to downvote this answer without accepting that challenge.
For the benefit of those who come across this old question, I have recently written a small open-source library called MathCell that replicates the behavior of Mathematica's Manipulate using pure JavaScript. Documentation is available here.
The library is not for converting Mathematica code, but is meant as a replacement for people who want to embed interactive math in a web page. There is a template in the documentation to set up an area on the page containing HTML elements (range sliders, number inputs, checkboxes) for parameter input, with an output below them that can be an SVG plot, a 3D graphic using Three.js or simple text as desired.
And since JavaScript is limited in its available functions, I also started a library simply called Math to provide special functions and basic numerical operations, such as root finding, quadrature, integration of differential equations and eigensystems of real symmetric matrices.